
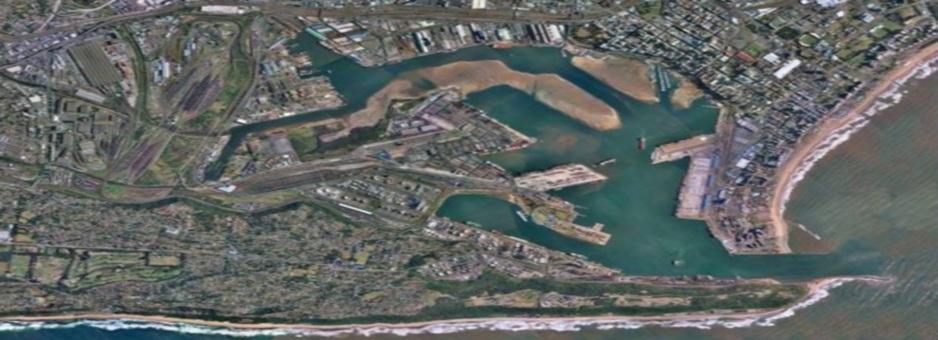
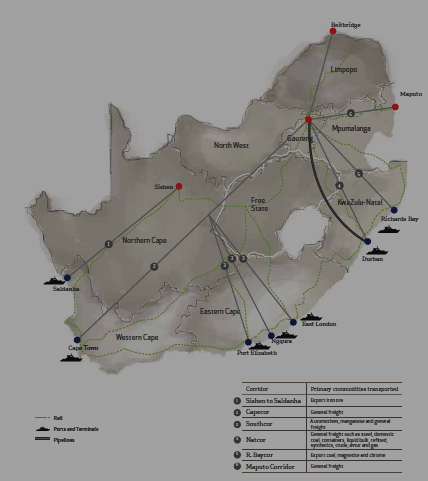
Diagram: Locational Analysis of the Port of Richards Bay - Source Transnet Annual Report - 2010
Introduction
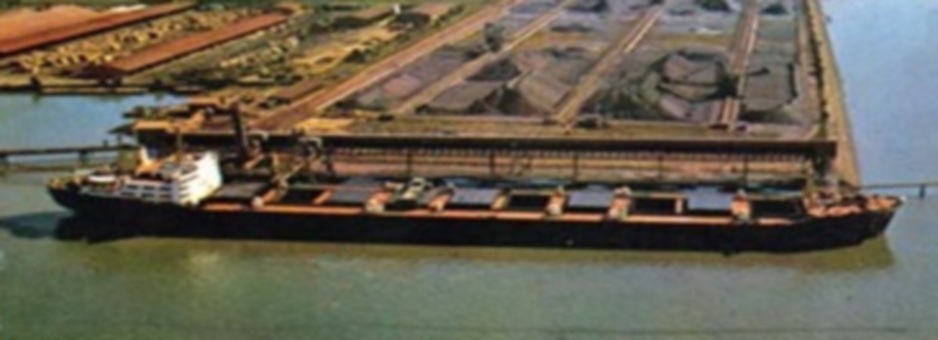
The past three decades has seen the Port expand rapidly in both volume and diversity of cargoes handled, with the current handling capacity in excess of 100 million tons/annum.
Port Infrastructure
Rail is the dominant carrier of goods and caters for 88% of cargo handled due to the established existence of coal handled by the port via the COALlink. Road traffic is significant but restricted to the Multi-Purpose and Dry Bulk Terminals on the northern end of the port. Finally, conveyors link to neighboring industries such as Billiton Hillside, Foskor and Woodchip plants for dry bulk cargoes.
Road Network
Direct external street network comprises of;
- John Ross Highway (R34)
- National Route 2- north-south link in KwaZulu Natal (National and Regional links).
- West Central Arterial- Links to Urania Road, the main access to the coal and liquid bulk terminals as well as to the Richards Bay CBD.
- Harbour Arterial- An alternative link to the port from John Ross Highway and provides access to the Alusaf Bayside smelters.
- Medway Road- Serves the Multi-Purpose Terminals (Berths 701-708) including the Ferro and Timber storage areas.
- Bayview BBoulevard- Serves the small crafts harbour and commercial developments on the eastern section of the Port.
Growth for the port continues to be in dry bulk cargo. However, coal has a definitive life span with volumes increasing steadily up to 2016/17 and decreasing after 2020 (at a rate of 2% per annum). With the exception of the multi-purpose terminal, movement of cargo by road is relatively low. The predicted growth rates for this terminal are 2% per annum, and accommodated by the current road capacity within the 20 year planning horizon.
The internal road network consists of:
- Newark Road: Serves the Multi-Purpose and Dry Bulk Terminals; and the Port Administration complex.
- Urania Road / Dune Road: Links the Richards Bay Coal Terminal and Island View bulk liquid storage areas.
- Medway Road: Links Newark Road and John Ross Highway.
- Bridgetown Road & Pioneer Road serves the small crafts harbour, Naval Island...
- Ventura Road: Link to the Port Administration complex.
- Quayside Road: Between berths 701 to 708 and forms "back of quay stack area".
- Tugela Road: Alongside the back of quay between berths 301 to 305 for service vehicles and links to the coal terminal administration area via Hardwick Road.
Rail Network
Total rail track at the port is 80 km forming an integral component to the port's logistic chain and accounts for approximately 88% of cargo movement by weight. Coal accounts for 78% of the total tonnage throughput, although the Dry Bulk, Multi-Purpose and Liquid Bulk Terminals also have relatively high rail usage. The coal terminal has a dedicated coal line linking the Port to the coal production areas in northern KwaZulu Natal and beyond. Currently the link carries 72 million tons of coal per annum (mtpa) and Transnet Freight Rail (TFR) is investigating options to increase capacity to 86 mtpa to cater for future increases. At the Coal Terminal the rail network is controlled by Richards Bay Coal Terminal (RBCT) who is responsible for all expansions, improvements, maintenance and also for all shunting operations.
Port Parameters
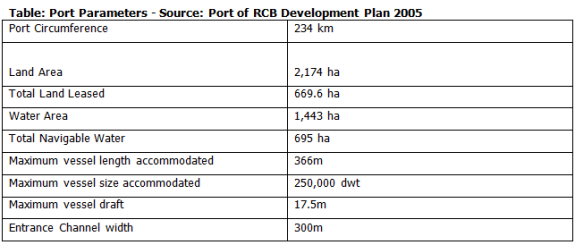
Port Terminals
The following tables present terminals and berth details, Breakwater/Quay Profiles, and port terminal operators and commodities handled.
Table: Port Terminals and Berth Details

Source: TNPA - Port of Richards Handbook 2009
Table : Breakwater/Quay Profiles

Source: TNPA- Port Development Framework Plan 2009
Table: Port Terminals Operators and Commodities Handled

Source: Port Handbook 2009
Introduction
Two critical components help assess port strategic fit and positioning, i.e. cargo previously handled and projected. This is best determined by quantifying "port activity" the last four years (2004-2009) as well as current activity; i.e. vessel arrivals (type of vessels and volumes contained); cargo volumes moving across the quays; commodities handled and also which commodities have consistently performed best.
Vessel Arrivals
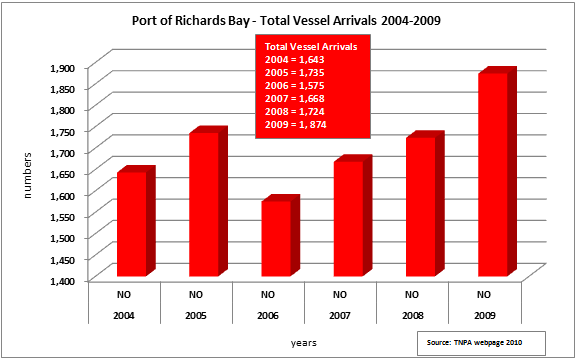
There has been a steady increase in total number of vessel arrivals in the port since 2004 with 2009 the highest at 1,874. Note that figures for August 2010 - 2011 are not included due to "unforeseen challenges" a brief view of 2010 sourced from Transnet Webpage presented (Jan- July 2010).
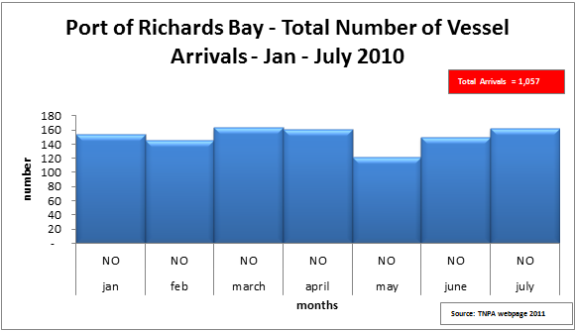
Based on the vessel arrivals at 1, 057 in July 2010, inferences can be made that figures will be consistent with previous counts, i.e. between 1, 700 to high 1,900 by year-end. Lower figures can be attributed to economic slow-down and the after-effects of the Transnet strike during 2010.
Cargo Trends in the Port 2004 - July 2010
Cargo types primarily moved through the port (2004-July 2010) are categorized into the following main groups: Break Bulk, Dry Bulk, Liquid Bulk, Containers.
Break Bulk
- Dominant commodities
- Aluminum Ingots
- Ferro Chrome
- Granite
- Pig Iron
- Steel
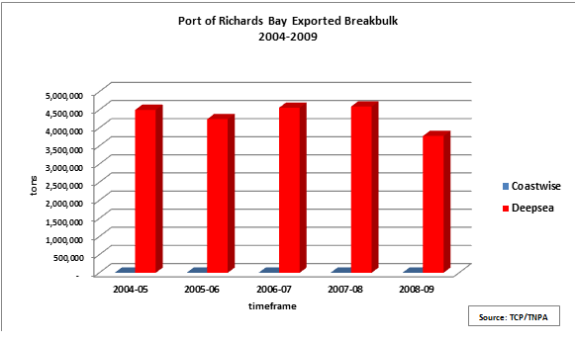
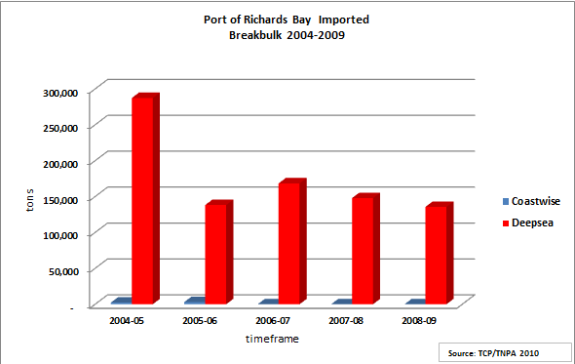
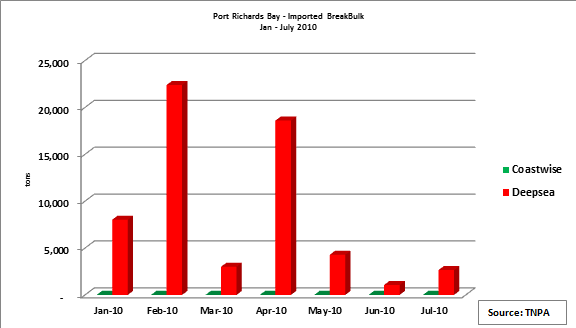
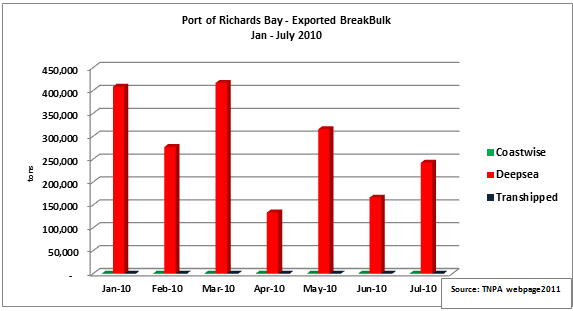
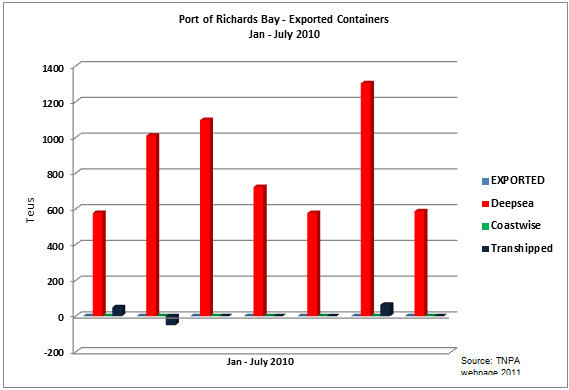
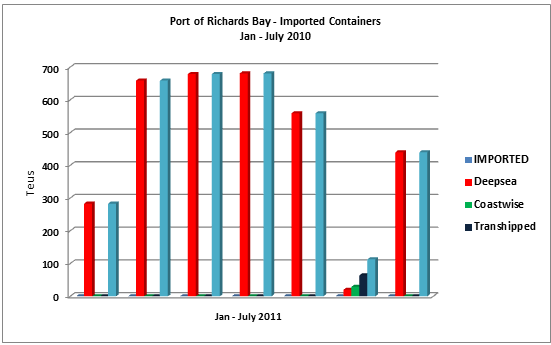
Breakbulk import vs. export ratio is predictably skewed towards higher/increased exports. Even with the brief trading of Jan - July 2010 figures, the relationship remains. In terms of transshipments, the port plays a limited role as seen by the low/near absent figures.
Dry and Liquid Bulks
- Dominant Dry Bulk Commodities
- Coal
- Alumina
- Coking Coal
- Chrome
- Sulphur
- Dominant Liquid Bulk Commodities
- Bulk Liquids
- Phosphoric Acid
- Fuel Oil
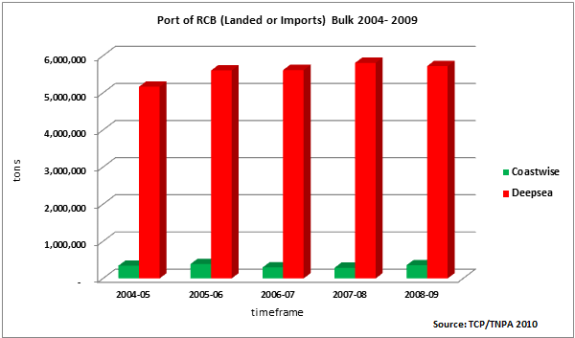
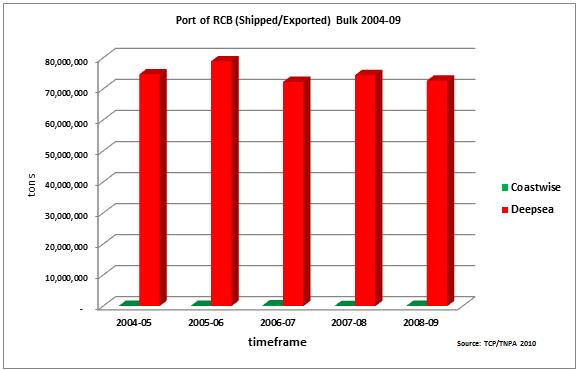
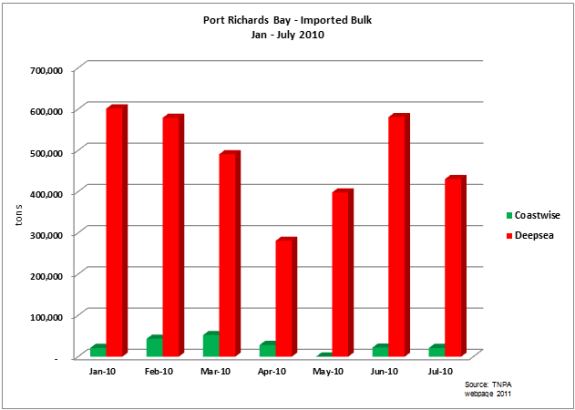

Observations:
Coal and coking coal remain the most dominant commodities in the port. The ratio between imports and exports highly skewed towards exports.
Containers
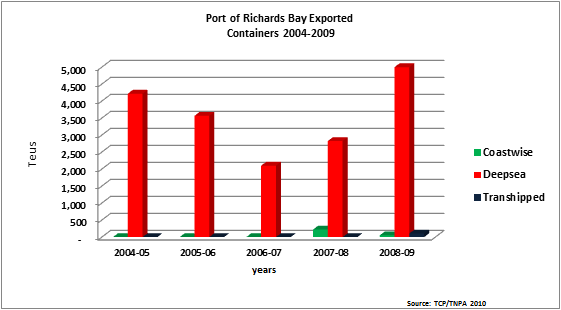
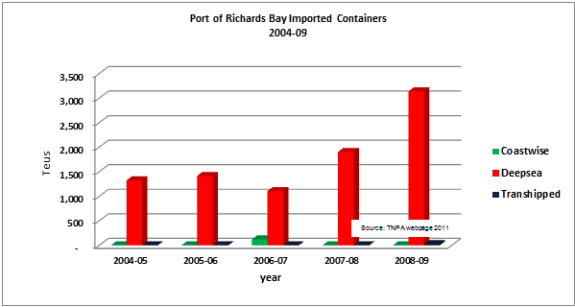
The volumes of containers through the port is small compared to ports such as Durban, Cape Town and even Maputo. Imported containers reached the highest in 2009 at 3,140 Teus, compared to exports during the same year at 4,999 Teus. The lowest figures recorded are in 2006/07 where both imports and exports were low at 1,107 and 2,101, respectively.
(source: National Infrastructure Plan by Transnet (2009 and 2010))
The basic principles applied for developmental (spatial distribution; forecasting, etc.) planning purposes are as follows:
- Capacity Calculation = port transhipment + import + export + empties
For Automotive sector, forecasting is conducted in tons. The conversion to units is as follows:
Automotive Conversion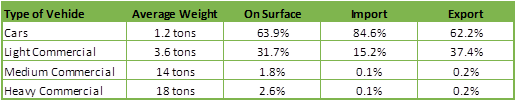
- Corrective forecasting measures were applied in 2007/08. Predictably, growth has been affected by the world recession, thus infrastructure in most instances has been developed too ahead of demand. A moderate and balanced approach to mitigate against (low and high) growths has been to merge the short term fluctuation in the growth of the economy with the long term 30 year forecast.
- Of importance to note is the unique "grouping" of cargoes used in South Africa vs. those in Europe. Instead of a 62 commodity system, South Africa utilises a 92 commodity system. This is best observed in projected bulks (break, dry and liquid). To achieve better "comparability" total volumes per cargo are proportionally distributed across the port system. In the following graphs there is SA Ports imports (based on 62 commodity system) vs. NPA SA imports "adjusted" according to NPA type split.
- The demand forecast is for the next 4-5 years (2010- 2015).
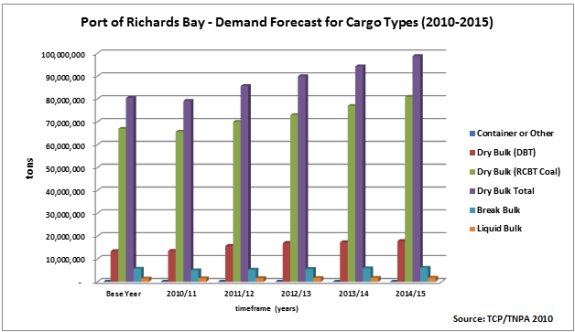
Deviations exist between break-bulk compared to dry and liquid bulk overall even though, dry bulk figures are still the highest, a testimony to the national status as a "mineral-driven" producer. The totals for import and export are comparable. Only the split of the three package type is significantly different. (Source: NIP - Transnet Capital Projects - 2010)
According to Transnet, dry bulk cargoes and their projected growth and movement will be dependent on Transnet Freight rail (TFR) expansion program, i.e. coal and iron ore, etc. will be capped at tons that TFR can meet. These volumes in turn will be dictated by demand (market and prices)
The port plays an important role within the regeneration and competitiveness of the national and regional economy especially in terms of moving high volumes of bulk cargo. In this regard, the Port Authority has a mandate to ensure that infrastructure is developed ahead of demand with critical performance measures for greater productivity and producing a consistent rate of return. This is best demonstrated by the continued assessment of planned projects such as: Ship repair facility, additional bulk liquid handling berth and break-bulk & dry bulk berths, upgrading roads and rail services and in the longer term a container handling facility at an existing berth. Caution is given in cases where forecasting measures have to be adjusted in response to externalities as this can result in over capitalization and building "white-elephants".
Operational challenges and market forces are a determinant factor to the port's ability to meet targets set by the broader "Transnet" machinery and/or stakeholders; i.e. cargo owners, consumers. Secondly, international markets dictate supply and demand of some key goods moving through the port; i.e. China's growth and development has produced a higher demand for raw mineral such as manganese, coal, etc. In recent years the port has lost cargo to Port of Maputo, especially in bitumous coal. Increased volumes of manganese, coal and fruit is being redirected to either Maputo or Cape Town (preferred port for fruit). Cargo owners see road haulage a surer bet in terms of creating bigger margins in productivity and retaining their global market share.
In conclusion, located in proximity to the Maputo Corridor and Port Maputo, makes the port a natural partner for cargo movement and increased efficiencies in the region. This is good situation to be in as a port as it will continually focus a cohesive infrastructural program and approach to service and customer delivery. The Port serves as an "end-node" in the logistics chain therefore providing efficient and "predictable" service to all customers, should be more than lip-service because anything different will result in lower productivity and market share for the port.
Main Menu

Other Links
Copyright © 2012 Limpopo Province Freight Transport Data Bank | Developed and Powered by Safiri South Africa.