
Introduction Forestry refers not only to the use and management of forests but also includes the further processing of wood products into pulp for the paper and packaging industries, sawn timber, furniture, shelving, flooring etc. In addition, forestry includes the use, management and processing of non-timber forest products, a vast category involving fruits, plants, medicinal herbs and animals found in forests and woodlands. Forestry also means the use of forest woods for fuel and for the manufacturing of charcoal; the production of important construction materials, including wooden beams, poles and thatching; and the provision of grass for grazing for domestic and wild animals. South Africa’s lumber milling industry is founded upon timber from intensively managed plantations of exotic pines and eucalypts. Some of these plantations are amongst the most productive in the world. The country’s sawlog plantations produce high quality raw material. Growing conditions are favourable and with few exceptions management is efficient. Seventy-five percent of South African plantations are FSC accredited, which is amongst the highest percentage in the world.
| ||||||||||||||||||||||||||||||||||||||||||||||||||||||||||||||||||||||||||||||||

| Comparison by province, of the 2006/2007 plantation area | ||||
| Province | 2007 | 2006 | ||
| Afforested Area | Afforested Area | |||
| Hectares | % | Hectares | % | |
| Limpopo Province | 48,096 | 3.8 | 48,778 | 3.8 |
| Mpumalanga | 514,831 | 40.7 | 521,257 | 40.7 |
| North West Province | 126 | 0 | 126 | 0 |
| KwaZulu Natal | 486,967 | 38.5 | 490,781 | 38.3 |
| Eastern cape | 155,079 | 12.2 | 158,862 | 12.4 |
| Western Cape | 61,097 | 4.8 | 61,715 | 4.8 |
| Total | 1,266,196 | 100 | 1,281,519 | 100 |
Source: DEPARTMENT OF WATER AFFAIRS AND FORESTRY
There is a total of 48 400 ha of sustainable managed plantations in the Tsitsikamma area, which are geographically spread out over 200 km. The forests consist of Pinus radiata, elliotti and pinaster, which are pruned on a sawlog regime primarily for construction grade products for the joinery industry. The Boskor sawmill form the hub of the Tsitsikamma region.
Distribution of timber species
Pinus patula is the softwood species planted most extensively in South Africa, comprising 340 766 hectares or 50.3% of the total softwood area. The species occurs mainly in Mpumalanga North and South, KwaZulu-Natal and the Eastern Cape. Pinus elliottii, comprising 28.4% of the softwood plantation area, is found in all regions except the Western Cape where Pinus radiata is virtually the exclusive softwood species. The total Pinus radiata area amounts to 59 190 hectares and is confined to the Cape regions.. Better quality pine is sold as saw logs for building and industrial purposes. Chipped Pine sawmill waste is sold to pulp producers. Particleboard manufacturers also use pine
The regions with the largest hardwood area are the Provinces of KwaZulu-Natal and Mpumalanga South where 46.9% of all hardwoods occur. The dominant species is Eucalyptus grandis, which accounts for 45.7% of the total hardwood area. South African hardwoods are grown primarily for pulpwood and mining timber production on an eight to twelve year rotation and hence the apparent young ages of the Eucalyptus plantations shown in Table IV.
Primary Management Purpose of Plantations
55% of all plantations are managed for pulpwood, 36% for sawlogs, 5% for mining timber and 3% for other purposes. Softwoods are managed mainly for sawlog production (65%), whilst 80% of the hardwood area is managed for pulpwood production.
Definitions of different types of sawmills
Definition of a Formal Sawmill: Log intake of not less than 15,000 m³ per annum, increasing to the largest mill in the country of ±250,000 m³ per annum. These mills dry the lumber and supply SANS (SABS) grade, structural and appearance grade timber. They are location bound, operate throughout the year and supply 66% of the sawn timber market.
Definition of a Bushmill: These mills are highly mobile, often moving to burnt plantations. They usually supply the local community with wet or air dried timber at a low price and also produce pallet and cable drum timber for the nearest market and account for 7% of the market.
Low Cost Mills (LCM.s): These are mills which have been upgraded from Bushmills, have become location bound and work throughout the year, normally having kilns and serving the appearance grade market with some of their production. They accounted for 27% of the market in 2003. They often use smallwood and .a. class logs.
Sales Volumes from Plantations
The total value of reported sales of timber based products in 2006/2007 amounted to R18 465 million an increase of 17.8% on the value of R15 679 million reported for the 2005/2006 period. Woodpulp and paper products continue to dominate the industry accounting for R9 831 million (2005/2006: R7 352 million) or 53.2% (2005/2006: 46.9%).
A comparison of sales volumes from plantations for the period 2006/2007 and 2005/2006 is shown in the table below. As indicated, although the sale of pulpwood has decreased, it still makes up the bulk of wood sold in 2007.
|
Sales Volumes from Plantations |
||
|
Product |
2006/2007 |
2005/2006 |
|
Sawlogs |
5,373,608 |
5,778,023 |
|
Poles |
356,300 |
344,731 |
|
Mining Timber |
516,478 |
634,592 |
|
Pulpwood |
10,761,549 |
12,046,402 |
|
Charcoal & Firewood |
244,029 |
236,822 |
|
Other |
152,919 |
150,007 |
|
Total (Tons) |
17,404,883 |
19,190,577 |
Of the sales volume as indicated in table, the Eastern Cape accounted for 1000 618 m³ of saw logs & venner, 220 567 m³ of poles &droppers, 132 960 m³ of pulp wood and 54 592 m³ of charcoal & firewood.
Within the Tsitsikamma area, approximately 300 000 tons of saw logs are transported annually from the plantations to the various sawmills in the area, of which 137 000 tons or 137 000m³ of saw logs made up of pine and gum, are hauled to the saw mill at Boskor. The logs vary in length and diameter from 1,8m to 18,2m and the latter from 8cm to 100cm. The mill produces approximately 71 500 tons of pine planks, varying in length, thickness and diameter, with the longest plank measuring 6,6m.
Statistics
See excel spreadsheets: Forestry statistics 1999 – 2005 % 2007
Source of power
The Tsitsikamma has an independent source of power because it can generate its own electricity through its six boilers that supply steam to the kilns and the massive generators. This is possible by the recovery of approximately 50% of waste from the cut timber. In the 1960’s the mill used to supply power to the whole of the Tsitsikamma, but unfortunately, unlike international trends, Eskom does not allow private companies to feed power into the grid to alleviate some of the load it has to carry. Discussions are currently under way between MTO and Eskom to possibly change this. Many sawmills can assist the national and local economies by generating power through utilisation of their own mill waste.
Transport
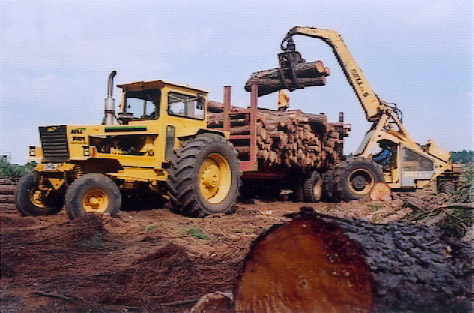
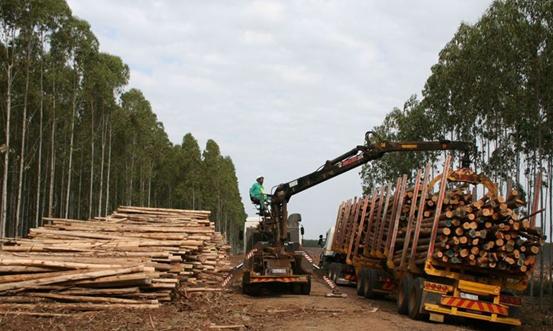
The
timber is transported via road to various processing
plants, mills and for export. Approximately 1,7 million
tons of timber are transported on Eastern Cape roads. The make up
of the fleet are usually flat decks with steel stakes and
the vehicle configuration varies from rigids to
interlinks. For the Tsitsikamma area,
the N2 is the only
road connecting the Tsitsikamma forest to the markets and
the closest towns are Plettenberg Bay, Kareedouw and
Humansdorp. Therefore road is the only form of transport
used at these plantations. The saw mill make use of
contractors to transport the cut saw logs from the
plantation to the sawmill and from the sawmill to the
clients.
Most of the timber is distributed to
Gauteng, Western
Cape and locally
distributed within the Eastern Cape.
Statistics
Forestry - Class Age Distortion 2005
Forestry - Forestry Statistics 1995 - 2005
Forestry - Forestry Statistics 2007