Air Cargo Operations Cargo statistics
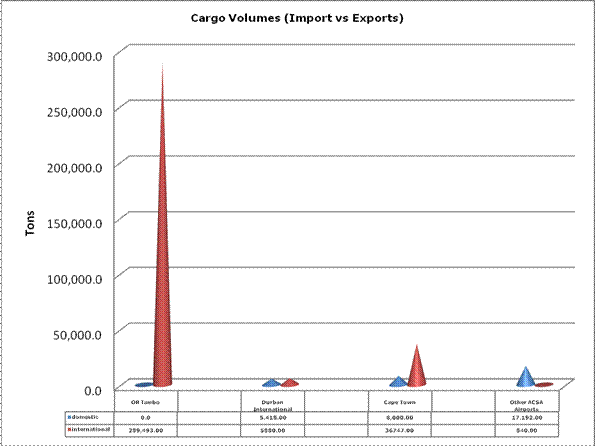
As previously stated, air cargo in South Africa is on an upward trend. The expected growth trends are of a 30% increase by 2012 with further projections to double to 850,000 tons by 2022. What is consistent across is the ratio of outbound vs. inbound, i.e. inbound cargo exceeds outbound volumes. From 2007 figures, overall cargo growth pressures in domestic vs. international volumes demonstrate future challenges that will have to be addressed in providing capacity at key airports in the country. Currently, OR Tambo (JIA) moves the highest volumes, with Durban and Cape Town rounding off the top three.
Figure 1-1: Cargo Volumes (imports vs. exports in ACSA operated Airports)
Source: ACOC - 2007
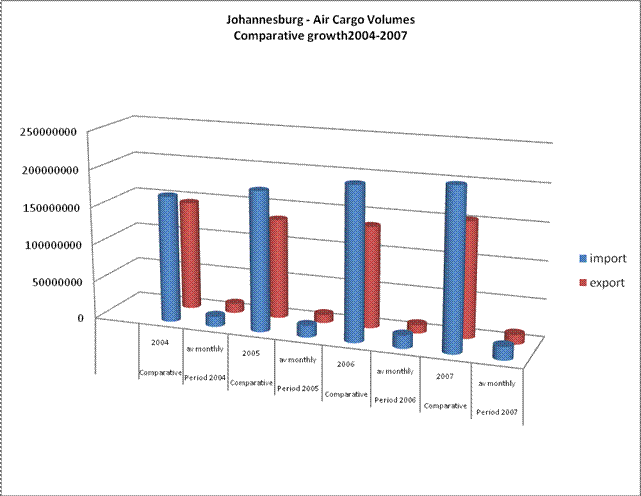
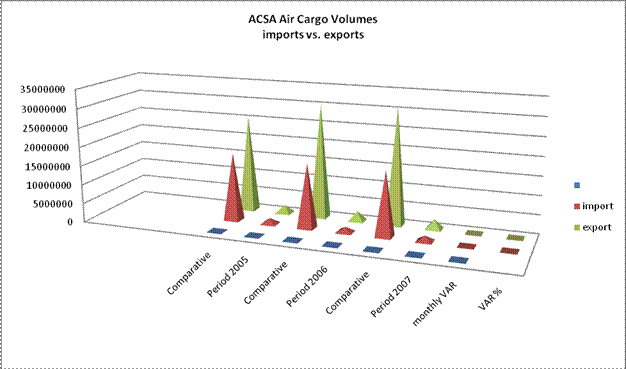
Cargo statistics presented below reflect growth trends over time at these airports. The primary cargo operators are SAA, SAFair, and Express Air Services.
Figure 1-2: ACOC International (Import vs. Export) Tonnages at OR Tambo
Figure 1-3: Comparative Air Cargo Volumes growths (2005 – 2007)
In terms of commodities, Cape Town tops the chart at exporting ~ 10, 916, 601 kg of fish produce; PE is second with Seats (except dentist, barber, etc, chairs) at 1, 013,925 kg. The list of key commodities being exported and imported through Port Elizabeth (PLZ), Durban International Airport (DIA) and Cape Town International Airport (CTIA) is not comprehensive, but gives the reader a feel of commodities moving through the air freight supply chain. These figures are estimates based on SARS data from 2006. Cargo Capacity Analysis
To calculate the maximum cargo the airport can handle, does not only depend on the dimensions of the warehouse or the aircraft. Airport facilities or infrastructure are examples that influence the limit of cargo handling in an airport. Capacity calculations are necessary to get a proper view for the future of cargo. Latest data on Air Freight provided by ACOC and DoT - 2007 Cargo volumes in these three airports account for 70% of all air freight within the system. Pressures that require serious analysis is how to ensure mode integration in order to eliminate transference of bottlenecks from one mode to another; i.e. air to road. In addition, it has to be factored that not all existing airports require being Airfreight Hubs, as there is not enough demand to justify the capital intensive expenditures, i.e. La Mercy, Polokwane or Upington considerations. The data received is not accurate, given that most of the stats do not come from consistent sources; they fluctuate from ACSA, ACOC, ICAO Air Transport Reporting Form, individual airport such as Lanseria, etc. In addition, the figures only document that Durban handled about 16, 191 in 2006, but no data is available for 2007. |